

Integrate Google Charts and Chart.js with viaSocket
These apps are in beta, and we are awaiting verification from the app builders
before making them accessible to end users.
This process may take 15 to 30 days.
If you can’t wait, we can add the beta version to your viaSocket workspace within 24 hours.
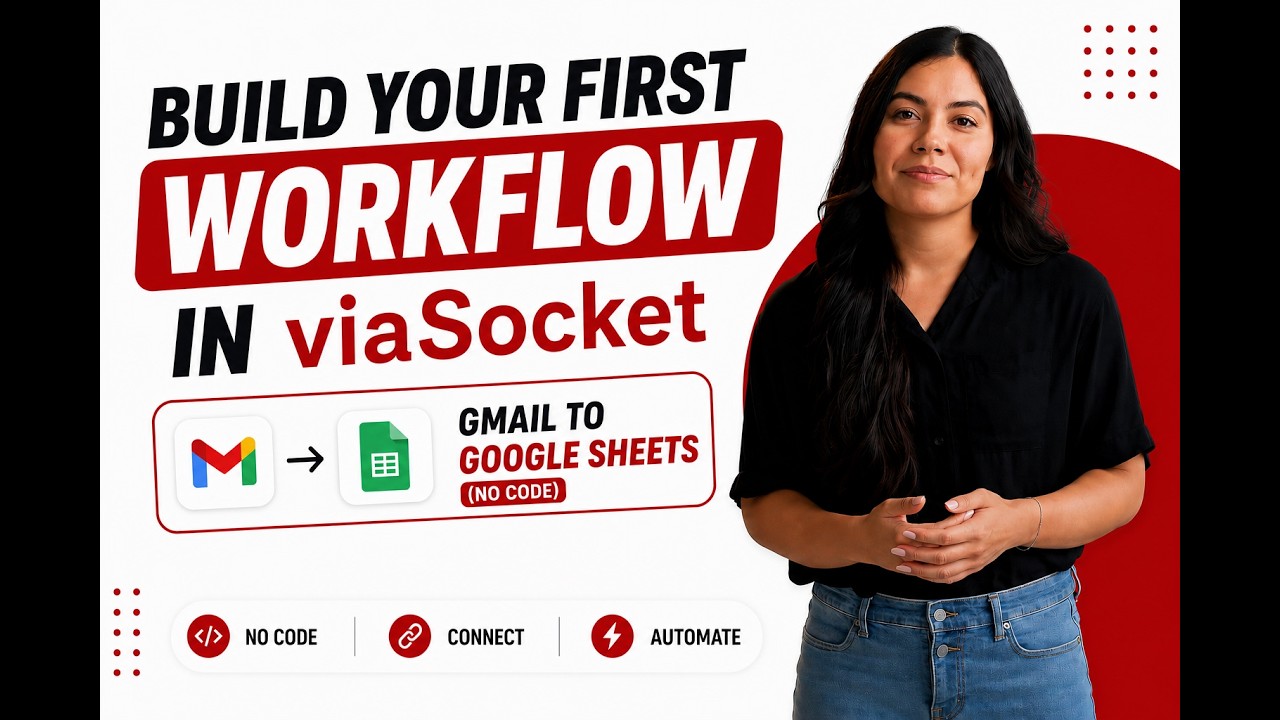
Learn how to build your first workflow
Follow a simple walkthrough to create, test, and launch your first automation.
- 1
Connect your apps
Link the apps you want to automate.
- 2
Configure your workflow
Set up triggers, actions, and map your data.
- 3
Test & publish
Test your workflow and publish it.
Trusted by Thousands. Recognized by the Best.
Recognized by leading review platforms and trusted by 10,000+ businesses worldwide.



From idea to automation.
AI will build it for you
Just describe the task in plain English. viaSocket AI selects the right apps, builds the workflow, maps the fields, and prepares everything for review before you publish.
Learn More About Automation

How viaSocket Works | A Complete Guide
Discover viaSocket, an AI-powered workflow automation platform with 2,300+ integrations. Learn what it is, how it works, and how to set up no-code automated workflows.

5 Simple Automation Hacks to Make Your Team Free
Five practical automation hacks to cut repetitive tasks and boost productivity using viaSocket, covering lead generation, onboarding, accounting, support, and HR.
What is Workflow Automation - Definition, Importance & Benefits | A Complete Guide
Explore workflow automation: its definition, benefits, how it works, real-world examples, and how to automate with viaSocket.
What are Webhooks - Definition, Working, Usage & Examples | A Complete Guide
Discover what webhooks are, how they work, and when to use them. Compare push-based webhooks with APIs and polling, with practical examples and ViaSocket integration.
viaSocket Support
We're here to help

Instant answers
AI assistant available 24/7
Expert support
Connect with our specialists
Trusted & secure
Your data is safe with us
Start automating Google Charts and Chart.js free
No credit card required. Set up your first workflow in minutes.

About Google Charts
Google Charts is a powerful tool that allows users to create a variety of interactive charts and data visualizations directly from their web browsers. It is designed to help users present data in a visually appealing and easily understandable format, making it ideal for reports, presentations, and dashboards.
Learn moreSimilar apps


About Chart.js
Chart.js is a popular open-source library for creating interactive and visually appealing charts and graphs on web applications. It provides a simple yet flexible API for developers to integrate various types of charts, such as line, bar, radar, and pie charts, into their projects with ease.
Learn moreSimilar apps
Frequently Asked Questions
Sign up for a free viaSocket account, then authorize both your Google Charts and Chart.js accounts. From there, pick a trigger in one app and an action in the other. Your first workflow can be live in under five minutes.
Yes. viaSocket uses instant triggers where available, so data moves between Google Charts and Chart.js as soon as the event happens. Scheduled polling triggers run at a maximum interval of 15 minutes.
Yes. You can map specific fields, apply filters to skip records that do not match your conditions, and transform values before they reach Chart.js. No coding required.
Yes. You can set up a workflow where Google Charts triggers actions in Chart.js, and a separate workflow where Chart.js triggers actions in Google Charts. Both run independently and in real time.
viaSocket logs every run so you can see exactly what succeeded and what failed. Failed tasks can be retried from the dashboard without re-configuring the workflow.
Yes, there is a free plan that covers basic workflows between Google Charts and Chart.js. Paid plans unlock higher task limits, faster polling, and advanced features like multi-step workflows and conditional logic.
No. The entire Google Charts and Chart.js integration is built through a visual, point-and-click interface. Code blocks are available if you want them, but they are never required.

