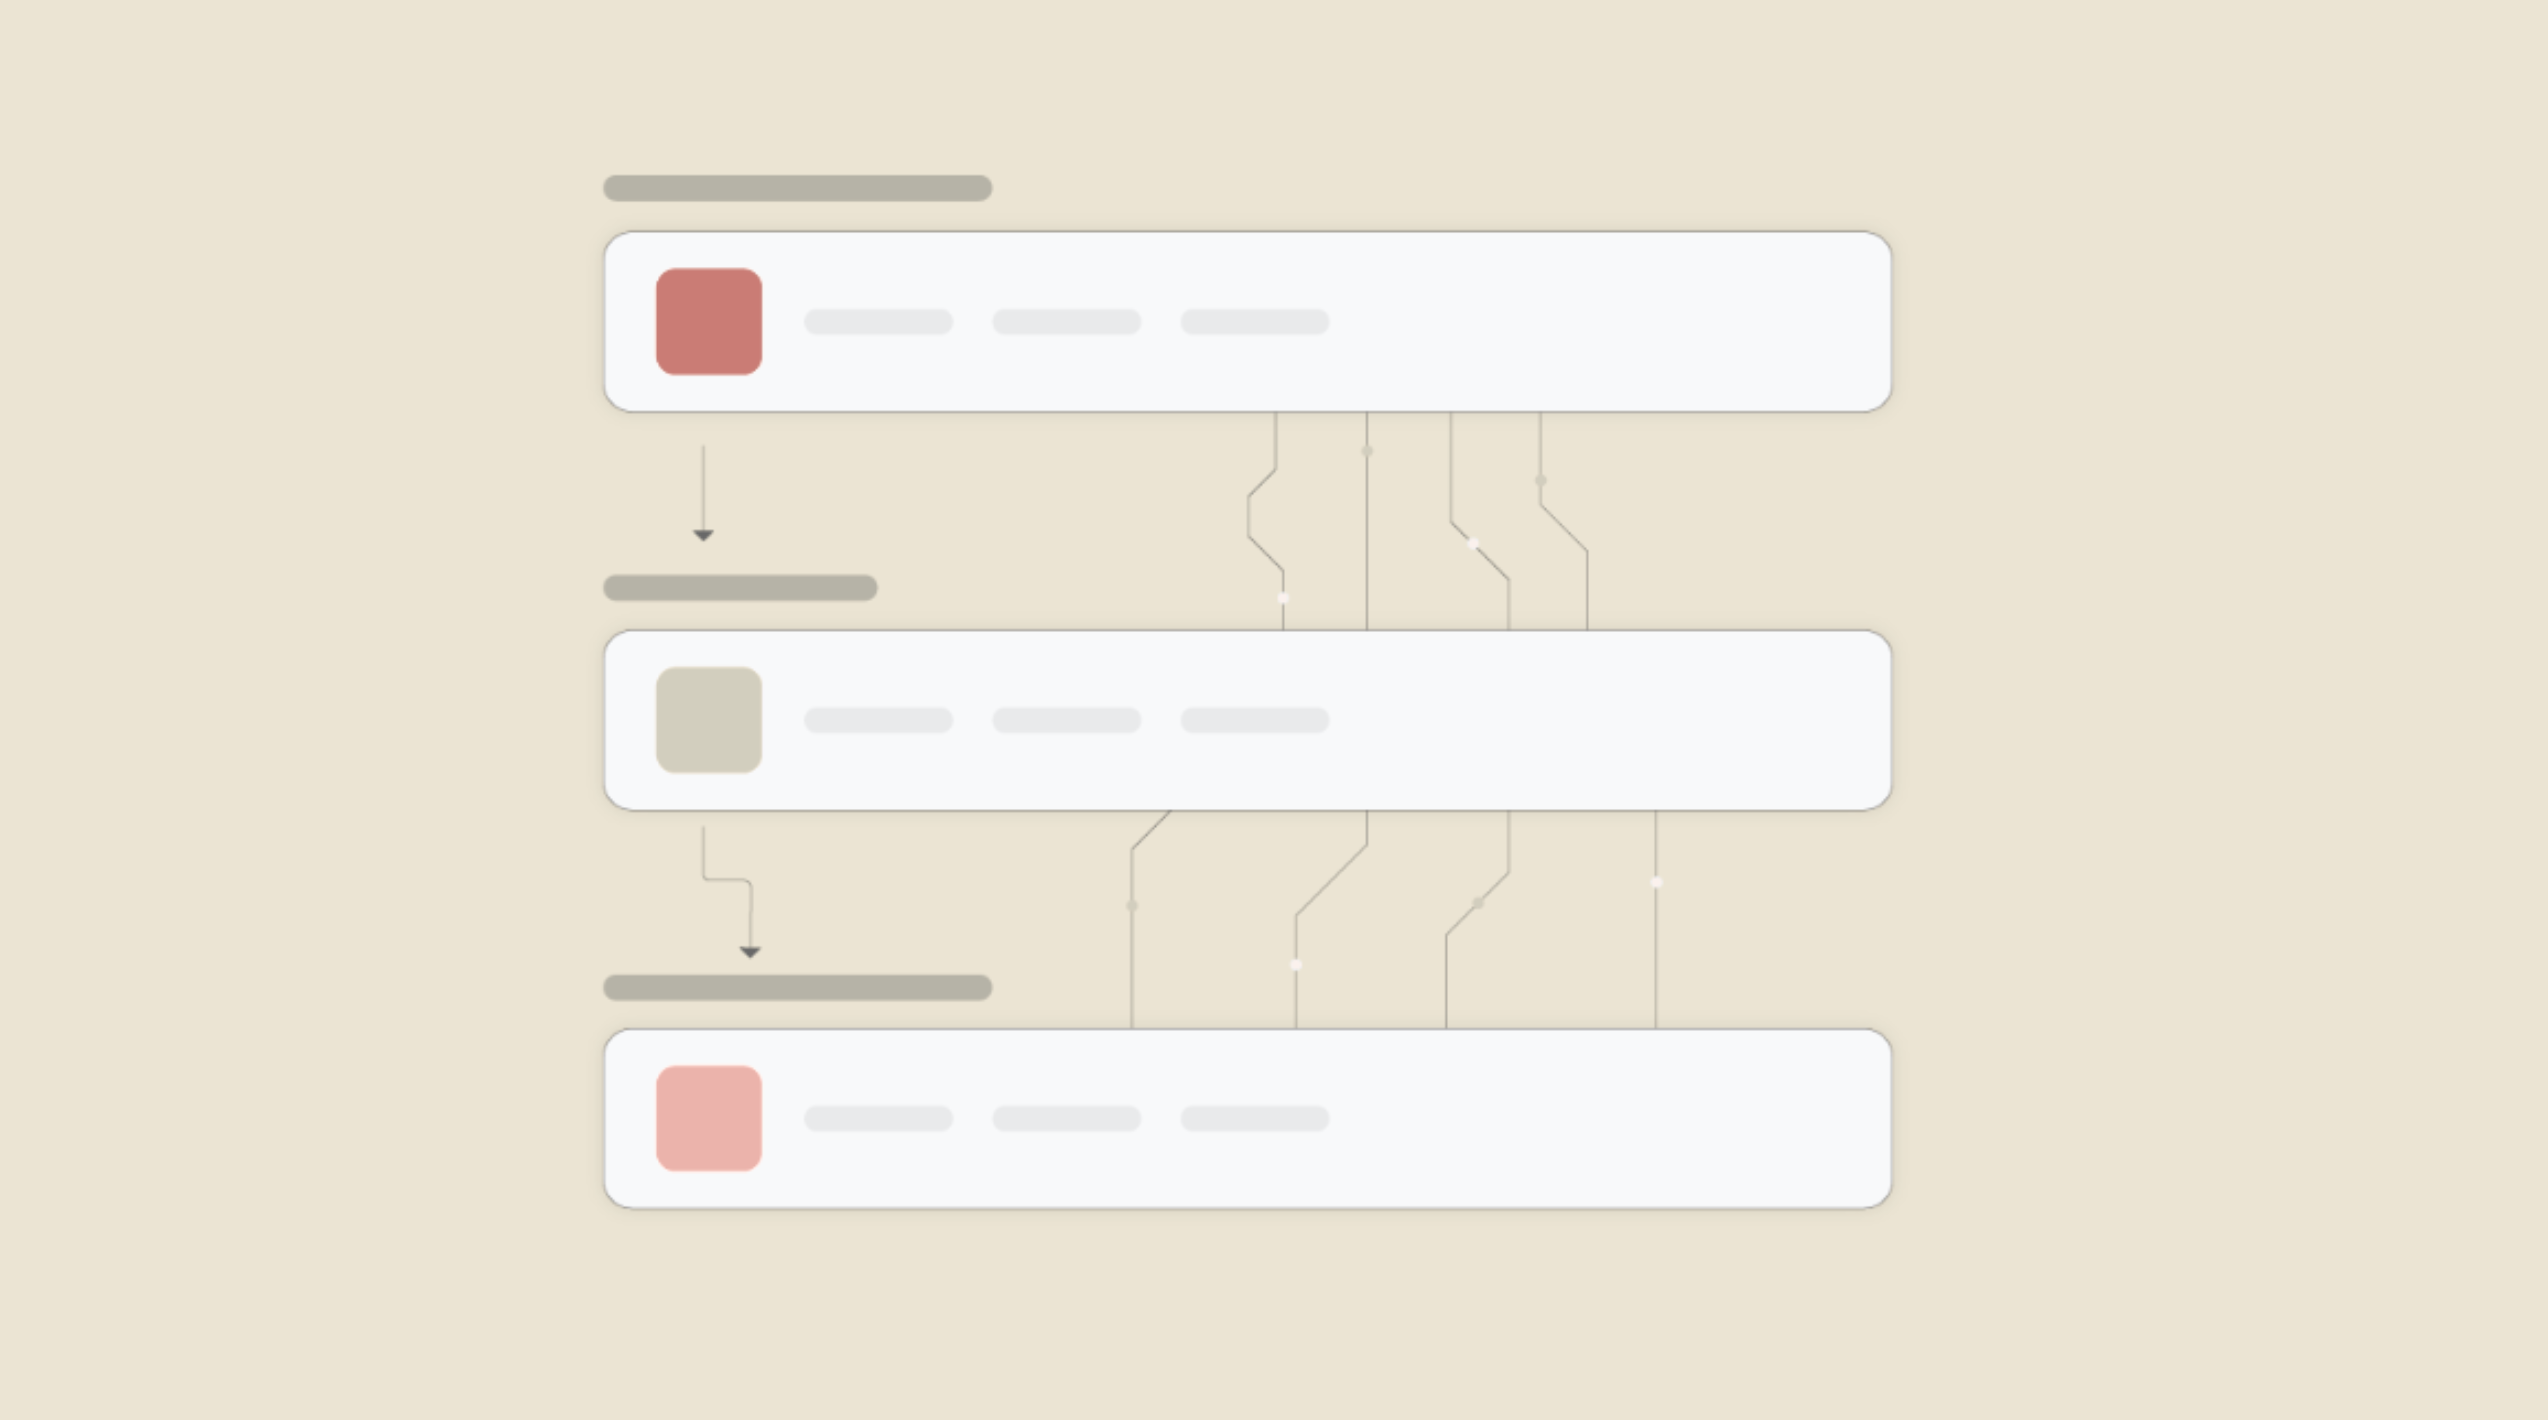
Connect Mem AI and Google Charts to Build Intelligent Automations
Choose a Trigger

When this happens...
- Request a new Trigger for Mem AI
Choose an Action

Automatically do this!
- Request a new Action for Google Charts
Enable Integrations or automations with these events of Mem AI and Google Charts
Enable Integrations or automations with these events of Mem AI and Google Charts
Actions
Create Note
Creates a new note
Explore more automations built by businesses and experts
Automate Instagram Comment Replies with Smart DMs
- text is ai
 ReplytoCommentSend a Private ReplyAdd Step
 - Is guide commentReplytoComment GuideSend a Private Reply GuideAdd Step
- multi keyword matchcmntdqJzLMYSReplytoCommentMultiKeywordAdd Step
Automate Expense Report Approvals via Slack & QuickBooks
- Send for Approval accept
 Create Entry of expensesAdd Step
 - Send for reject
 Mail for RejectionAdd Step
Automate Social Media Post Creation and Scheduling Across Multiple Platforms
- Instagram
 Instagram CaptionGenerate ImagePublish Photo with TaggingAdd Step
 - YoutubeYoutube Video ScriptYoutube Description Video
 Create an Avatar Video
 DelayRetrieve Shareable Link for a Video1
 Upload VideoAdd Step
 - TwitterTwitter Tweet
 Post a TweetAdd Step
 - LinkedinLinkedin Article
 Create a linkedin Article or URL postAdd Step


Know More About Mem Ai and Google Charts Integrations
How viaSocket Works | A Complete Guide
Gain insights into how viaSocket functions through our detailed guide. Understand its key features and benefits to maximize your experience and efficiency.

5 Simple Automation Hacks to Make Your Team Free
Unlock your team's potential with 5 straightforward automation hacks designed to streamline processes and free up valuable time for more important work.
What is Workflow Automation - Definition, Importance & Benefits | A Complete Guide
Workflow automation is the process of using technology to execute repetitive tasks with minimal human intervention, creating a seamless flow of activities.
Frequently Asked Questions
To start, connect both your Mem AI and Google Charts accounts to viaSocket. Once connected, you can set up a workflow where an event in Mem AI triggers actions in Google Charts (or vice versa).
Absolutely. You can customize how Mem AI data is recorded in Google Charts. This includes choosing which data fields go into which fields of Google Charts, setting up custom formats, and filtering out unwanted information.
The data sync between Mem AI and Google Charts typically happens in real-time through instant triggers. And a maximum of 15 minutes in case of a scheduled trigger.
Yes, viaSocket allows you to add custom logic or use built-in filters to modify data according to your needs.
Yes, you can set conditional logic to control the flow of data between Mem AI and Google Charts. For instance, you can specify that data should only be sent if certain conditions are met, or you can create if/else statements to manage different outcomes.
About Mem AI
Mem is an AI-powered note-taking and knowledge management tool designed to help users capture, organize, and retrieve information effortlessly. With its intelligent features, Mem allows users to create notes, set reminders, and collaborate with others, making it an ideal solution for both personal and professional use.
Learn MoreAbout Google Charts
Google Charts is a powerful tool that allows users to create a variety of interactive charts and data visualizations directly from their web browsers. It is designed to help users present data in a visually appealing and easily understandable format, making it ideal for reports, presentations, and dashboards.
Learn MoreviaSocket
For SaaS
For AI Agent Builders
Support
Automation Experts

Plans, Pricing and Offer
AI & Automation
© 2025 viaSocket |Privacy,TermsandData Retention & Deletion Policy
Walkover Web Solutions Pvt Ltd. | All rights reserved.