Connect Xodo Sign and Chart.js to Build Intelligent Automations

Enable Integrations or automations with these events of Xodo Sign and Chart.js
Enable Integrations or automations with these events of Xodo Sign and Chart.js
Triggers
Document Sent
Triggers when a document is sent.
Document Completed
Triggers when a new document is completed.
Actions
Create Contact
Creates a contact
Find and Download Document
Finds and downloads a document
Send Reminder
Send Reminder to document.
Explore more automations built by businesses and experts


Know More About Xodosign and Chartjs Integrations
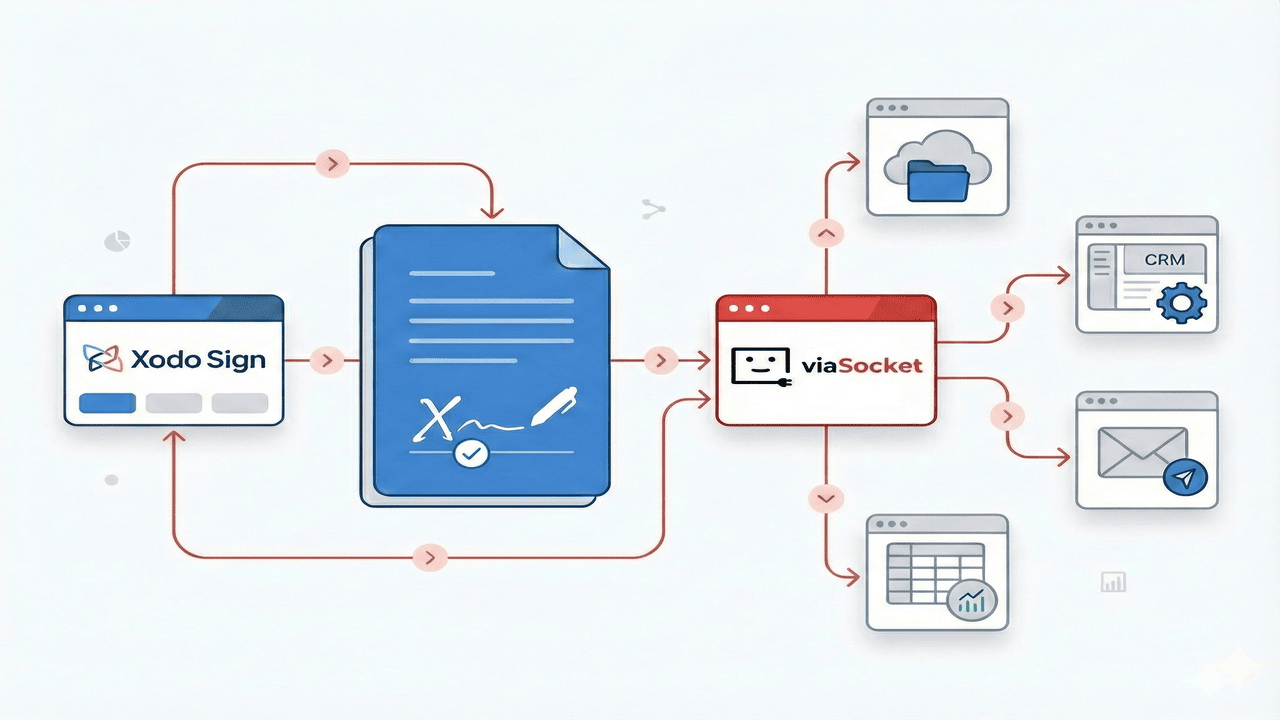
Xodo Sign Automation: Eliminate Manual Document Work
Automate Xodo Sign workflows with viaSocket. Send contracts, track signatures, save documents, notify teams, and update your CRM automatically.
How viaSocket Works | A Complete Guide
Gain insights into how viaSocket functions through our detailed guide. Understand its key features and benefits to maximize your experience and efficiency.

5 Simple Automation Hacks to Make Your Team Free
Unlock your team's potential with 5 straightforward automation hacks designed to streamline processes and free up valuable time for more important work.
Frequently Asked Questions
To start, connect both your Xodo Sign and Chart.js accounts to viaSocket. Once connected, you can set up a workflow where an event in Xodo Sign triggers actions in Chart.js (or vice versa).
Absolutely. You can customize how Xodo Sign data is recorded in Chart.js. This includes choosing which data fields go into which fields of Chart.js, setting up custom formats, and filtering out unwanted information.
The data sync between Xodo Sign and Chart.js typically happens in real-time through instant triggers. And a maximum of 15 minutes in case of a scheduled trigger.
Yes, viaSocket allows you to add custom logic or use built-in filters to modify data according to your needs.
Yes, you can set conditional logic to control the flow of data between Xodo Sign and Chart.js. For instance, you can specify that data should only be sent if certain conditions are met, or you can create if/else statements to manage different outcomes.
About Xodo Sign
Xodo Sign by Apryse is an electronic signature software platform that lets you sign, edit and send documents in one place. Xodo Sign helps businesses of every size replace printing, scanning, and mailing with fast, legally binding digital signatures and built-in document editing tools that save time, cut costs, and keep work secure.
Learn MoreAbout Chart.js
Chart.js is a popular open-source library for creating interactive and visually appealing charts and graphs on web applications. It provides a simple yet flexible API for developers to integrate various types of charts, such as line, bar, radar, and pie charts, into their projects with ease.
Learn MoreviaSocket
For SaaS
For AI Agent Builders
Support
Automation Experts

Plans, Pricing and Offer
AI & Automation
© 2026 viaSocket |Privacy,TermsandData Retention & Deletion Policy
Walkover Web Solutions Pvt Ltd. | All rights reserved.